Research Highlight · bioRxiv
OmniT2I: a unified table-to-image framework for survival prediction with incomplete multimodal cancer data
Molecular profiles and pathology slides describe a tumour at different levels, and together they say more about prognosis than either does alone. Few patients, however, have every assay. OmniT2I is a single model that predicts survival from whichever modalities a patient has and infers the ones that are missing.
- TCGA cohort
- 10,373 patients · 32 cancer types
- Modalities
- RNA, CNV, protein, DNA methylation, H&E
- External evaluation
- 7 cohorts · 3,901 patients

How real data go missing
RNA, copy number variation (CNV), DNA methylation and protein abundance describe different levels of molecular regulation, while H&E slides capture tumour morphology and its microenvironment. Each assay has its own cost, tissue requirement and platform, so the set measured for any one patient is partly a matter of circumstance.
TCGA shows how uneven this is. Among 10,373 patients from 32 cancer types, CNV was available for 97.6%, RNA for 92.1% and H&E for 92.0%, but methylation for 78.9% and protein for only 70.0%. Just 5,605 patients (54.0%) had all five modalities. A complete-case study would set aside nearly half of the cohort, while fitting one model per combination means covering 31 input sets, each trained on a different subgroup of patients.
How OmniT2I handles missing modalities
The model starts by giving every molecular modality the same kind of input. Each profile becomes a three-channel table-to-image (T2I) input. Features are placed by correlation, so related features sit near each other, and each feature keeps the same position in all three channels:
- C1: standardized measurements;
- C2: deviations relative to the patient's cancer type;
- C3: measurements weighted by Cox score statistics from training patients.
Masked reconstruction pretrains separate encoders for RNA, CNV, protein and methylation. H&E tiles are encoded with the frozen Prov-GigaPath foundation model, aggregated per patient and passed through a trainable adapter. A shared projection then places all five modality embeddings in one representation space.
Missing data are handled at two points. For survival prediction, availability-aware gated fusion combines the observed embeddings and gives missing modalities zero weight, so the same model accepts any input combination. For cross-modal inference, a target-conditioned translator predicts the embedding of a withheld modality from the others, and a decoder reconstructs its features. The predicted embedding can also enter the survival head alongside the observed ones.
The pathology branch follows the slide-to-patient workflow described in the research note From pathology slides to survival predictions: a frozen tile encoder, one patient-level record, then survival modeling.
Predicting survival from what is available
Across all 10,373 patients (3,258 deaths), the pooled C-index was 0.783 (95% CI, 0.776–0.790). Pooled concordance partly reflects differences between cancer types: a model using cancer type alone reached 0.743. The more demanding measure is within-cancer concordance, which ranks patients with the same cancer type. It was 0.631 under natural availability and 0.660 in the 5,605 complete cases.
Patients with higher predicted risk had worse survival, with cancer-stratified hazard ratios of 2.13 under natural availability and 2.37 in complete cases. In a post hoc analysis of 6,386 patients, the risk score remained associated with overall survival after adjustment for age, sex and stage.
One model versus a model for every combination
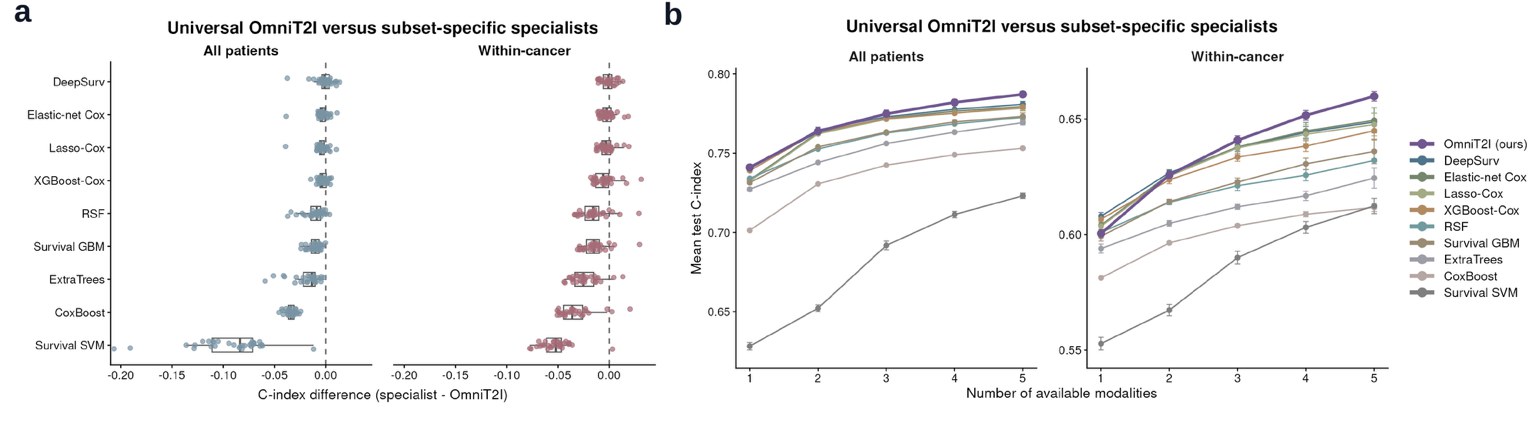
The alternative to a single model is a specialist for each input set. We fitted nine survival methods separately for all 31 combinations: DeepSurv, elastic-net Cox, lasso Cox, XGBoost Cox, random survival forest, survival gradient boosting, extra survival trees, CoxBoost and survival SVM. OmniT2I was trained on naturally incomplete profiles, the specialists on complete cases, and all were tested on the same 5,605 complete-case patients.
OmniT2I had a higher within-cancer C-index in 226 of 279 comparisons (81.0%) and in 240 of 279 pooled comparisons. Its advantage over five method families was clear (0.014–0.052); against DeepSurv and the penalized and boosted Cox models, the differences were small (0.001–0.005). Within-cancer C-index rose from 0.600 with one modality to 0.660 with all five. OmniT2I performed best on average with three or more modalities, while specialists remained competitive with fewer inputs.
Inferring the missing modalities
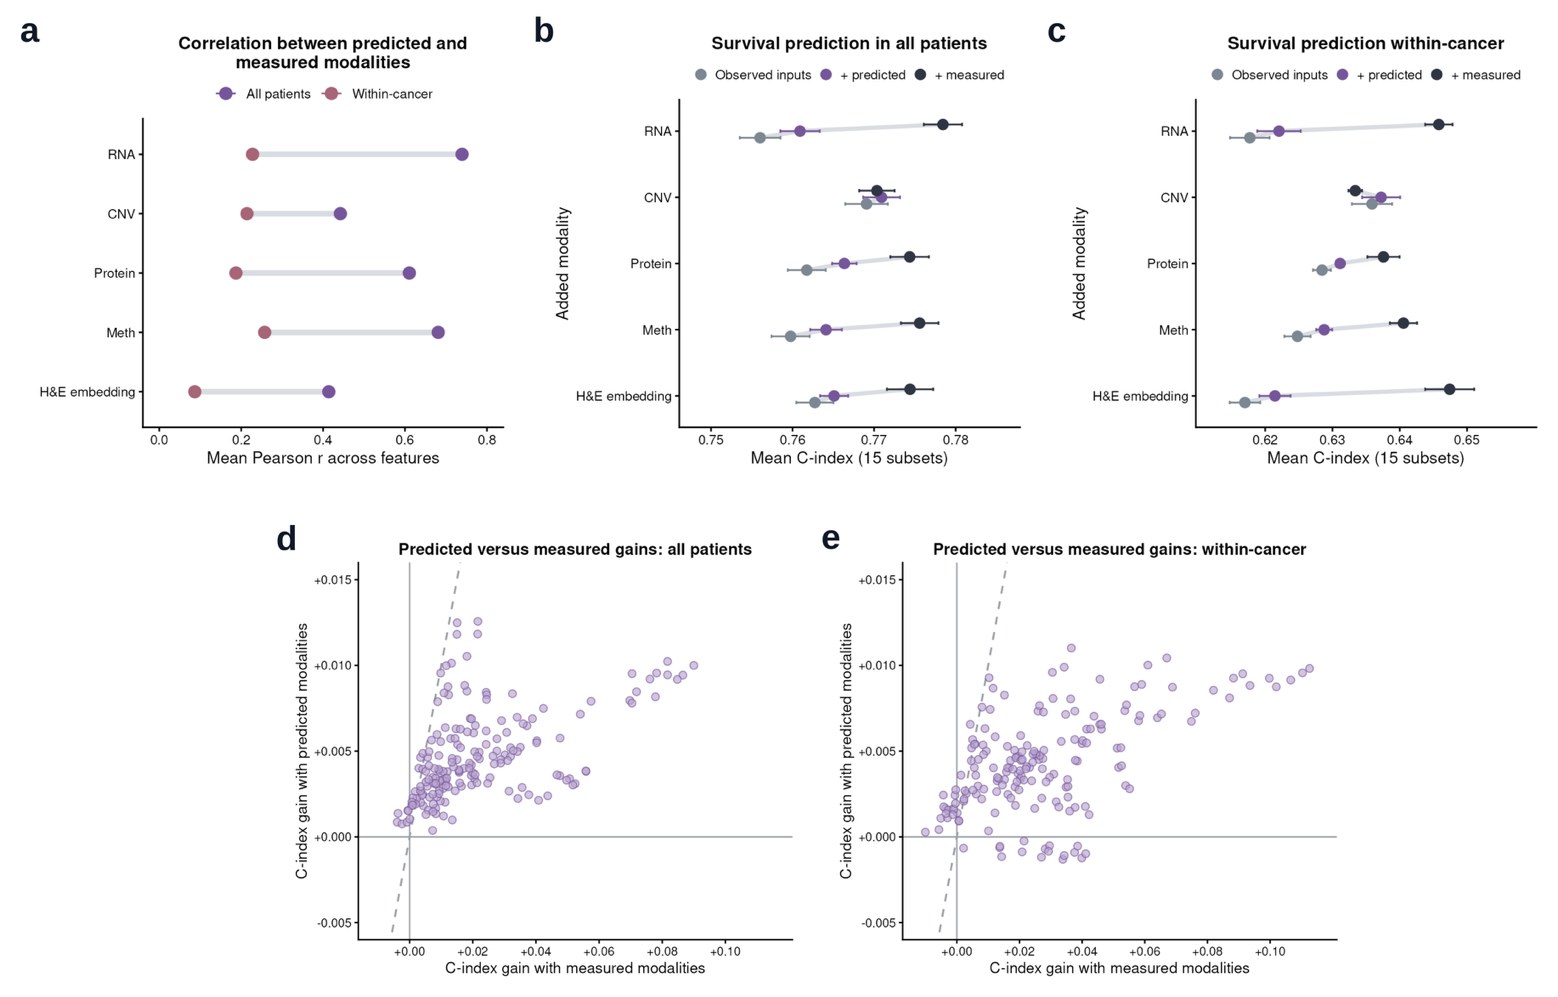
In complete cases, each modality was withheld in turn and predicted from the remaining ones. Mean correlations between predicted and measured features were 0.739 for RNA, 0.681 for methylation, 0.610 for protein, 0.442 for CNV and 0.414 for H&E embeddings. Reconstruction error was lower than a cancer-mean reference in 69 of 75 routes.
Reconstruction quality alone does not show that an inferred modality is useful. The survival question is whether adding it to the observed inputs improves risk ranking. It did so for pooled C-index in all 180 pairings of observed and withheld modality sets, and for within-cancer C-index in 164. The gains were modest, about 15–22% of the gain from adding the corresponding measured data. Of the 16 routes with negative within-cancer gains, 15 used H&E as the only observed input. Measured H&E gave the largest gain when added to RNA, yet as the only input it was the least useful source for predicted additions.
External cohorts and what drives performance
The frozen RNA-only model was applied to seven external cohorts (3,901 patients, 607 deaths): six CPTAC cohorts and the SCAN-B breast cancer cohort. External C-indices differed from same-cancer TCGA test performance by a median of −0.003 (range, −0.092 to +0.079). In SCAN-B, the largest cohort with 3,273 patients, the C-index was 0.637 versus 0.639 in TCGA breast cancer. The largest drop was in the HPV-negative CPTAC head and neck cohort.
Ablations showed which components mattered. Removing masked pretraining lowered within-cancer C-index by 0.028, replacing the correlation-based layout with a random layout by 0.011, and removing the Cox-weighted channel C3 by 0.006. The value of an additional measurement depended on the modality:
| Added modality | Change (95% CI) |
|---|---|
| H&E | +0.016 (0.003 to 0.030) |
| DNA methylation | +0.008 (0.001 to 0.014) |
| Protein | +0.0001 (−0.008 to 0.008) |
| CNV | −0.010 (−0.017 to −0.002) |
What the evidence supports
The results support three claims: one model can learn from naturally incomplete multimodal profiles and handle every input combination; it matches or exceeds specialist models trained for each combination, especially when several modalities are available; and inferred modalities carry some prognostic information, though less than real measurements.
Several questions remain open. TCGA and the external cohorts were assembled retrospectively, and complete-case comparisons may not represent patients whose assays are naturally missing. The specialist comparison mixes differences in model design with differences in training population. External evaluation tested RNA-only prognosis; multimodal integration and cross-modal inference still need external tests, as do calibration of absolute survival probabilities and incremental value beyond clinical models. Next steps include adding clinical variables and imaging, and testing the model in further independent cohorts. This is a preprint and has not been peer reviewed. The source code will be released upon publication.
Resources
bioRxiv preprint · PDF · DOI