Research Highlight · ESMO Open
Era-specific prognostic factors and an interpretable machine-learning survival model for RCC brain metastases
How has survival after brain-directed treatment changed as systemic therapy evolved, and which information helps estimate prognosis today? This study pairs a historical cohort analysis with an interpretable survival model for the immunotherapy era.
- Clinical cohort
- 929 patients · 1993–2021
- Clinical setting
- Clear-cell RCC brain metastases
- Modeling cohort
- 214 IO-era patients
Survival across treatment eras
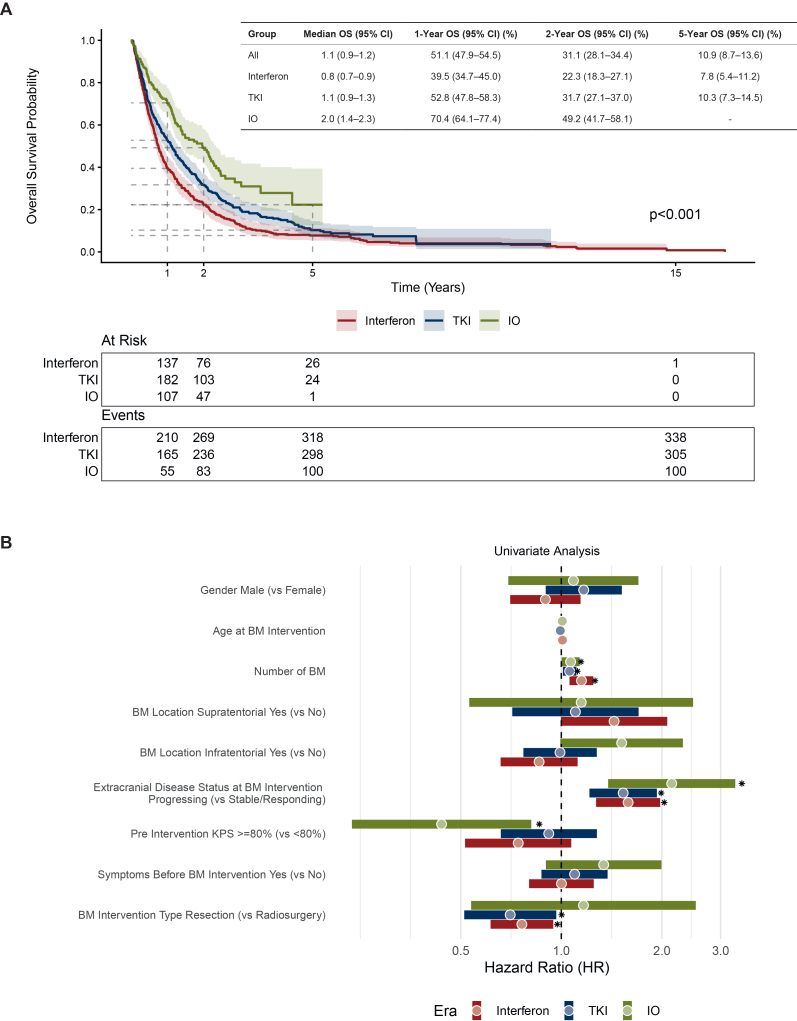
Median overall survival increased from 0.8 years in the interferon era to 1.1 years in the tyrosine kinase inhibitor era and 2.0 years in the immune checkpoint inhibitor (IO) era. The figure below places those differences alongside the prognostic factors associated with survival in each period.
Treatment era is a calendar-based grouping. It captures changes in care over time, including differences in detection and management, rather than isolating the effect of a particular drug.
The prediction model
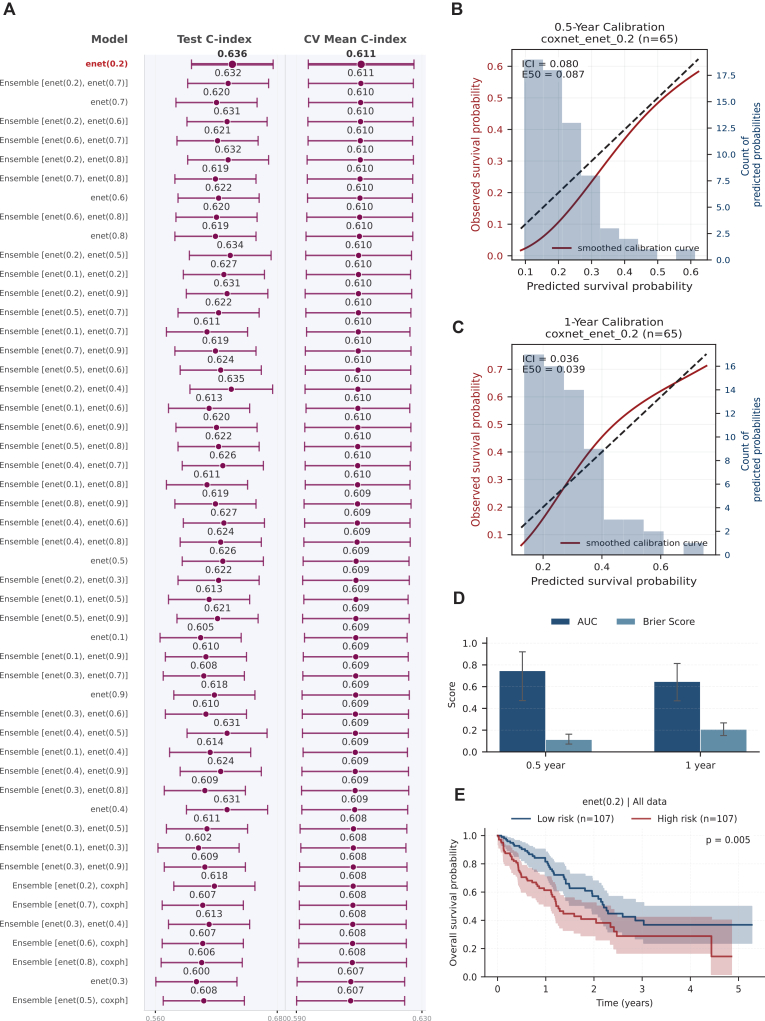
The machine-learning analysis focuses on the IO-era subset, using variables available before the first brain-directed intervention. Model selection uses cross-validation, followed by evaluation in a held-out test cohort.
The selected CoxNet model achieved a test C-index of 0.64 and a 6-month AUC of 0.75. The second figure also reports calibration and Brier scores. Those checks matter because ranking patients by risk and estimating an individual's survival probability are different tasks.
Interpretation and next steps
Extracranial disease status and age were prominent contributors to model predictions, alongside functional status and brain-metastasis burden. SHAP analysis makes those contributions inspectable at the patient level; it describes model behavior rather than identifying treatment effects.
The online calculator provides access to individualized predictions. External validation is the next important test. Patient-level systemic treatment details, tumour volumes, and laboratory variables used by established risk scores were unavailable, limiting what this cohort can compare.